

One Question, One Tool: The Avalanche Block Explorer Guide
As Avalanche scales its L1 infrastructure, relying on a single block explorer is no longer enough. Here is how to map your target questions to specialized native tools.


As onchain activity scales into hundreds of millions and even billions of transactions per quarter across major networks, explorers have evolved far beyond simple lookup tools. They now act as access layers into the structure of a network, surfaces for tracing value flows, evaluating validator behavior, and understanding how entire ecosystems move in real time.
On Avalanche, that capability is not concentrated in a single platform. It is distributed across a set of specialized tools, each designed to answer a different kind of question.
So the real skill is no longer just reading onchain data.
It is knowing which tool to reach for, and when.
This guide is not a directory of every explorer or dashboard. Instead, each section maps a real user intent to the right tool, explains why it fits, and shows when to move to another layer.
Firstly, we outline the exploration stack, from raw onchain data to dashboards and intelligence tools. Then we walk through common scenarios such as tracing a transaction, validator data, and DeFi activities.
The principle is simple: the tool should follow the question, not the other way around.
The Three Layers of Exploration
Before touching any tool, adopt this mental model. Onchain data exists in three layers, and most confusion comes from using a layer-one tool on a DeFi problem.
1. Raw Data
Transactions, blocks, smartcontract calls (the immutable blockchain record).
Tools:
Block explorers like SnowTrace, Avascan, Snowscan, Avalanche’s official Explorer.
These let you search hashes and addresses to see exactly what happened onchain.
2. Structured Insights
Aggregated charts, dashboards, and metrics that summarize what’s happening across the network (TVL, volume, active users, fees, etc.).
Tools:
Platforms like Avalanche Stats, Snowpeer, Avalanche Stables, Frosty Metrics, Burned AVAX, L1Beat (Avalanche L1 performance comparison).
Helpful non-native complements: Dune Analytics or DefiLlama.
These platforms turn raw data into readable trends and visuals, but they don’t show every individual transaction.
3. Contextual Intelligence
This is the interpretation layer. It connects addresses, clusters activity, and reveals behavioral patterns across the network.
This layer is typically powered by third party platforms such as Arkham Intelligence or Nansen.
Avalanche has strong native tooling, but deep wallet labeling and entity mapping still rely on these specialized systems.
Every use case in this guide pulls from one or more of these layers. Explorers confirm facts, dashboards summarize activity, and intelligence tools help explain behavior.
Scenario 1: “I want to trace a transaction”
Primary Tools:
SnowTrace (the primary explorer for Avalanche C-Chain transactions and smart contracts), SnowScan, and Avascan.
This is usually the first stop when you have a transaction hash and want to understand exactly what happened onchain.
Most users start with SnowTrace because it feels familiar and direct. You paste a hash and immediately get status, timestamp, gas usage, and token transfers. That answers the first question, which is usually “did it go through?” or “what assets moved?”.
From there, the real analysis begins.
In practice, use the tool in sequence:
Paste the hash → instant confirmation.
Jump to Token Transfers for the clean in/out summary.
Open Internal Transactions if it’s a complex DeFi swap, approval chain, or multi-hop router call.
Snowtrace excels at raw EVM depth: detailed lists of every internal call, decoded logs, state and token movements. It’s the tool you reach for when you need to audit exactly what happened step-by-step on the C-Chain.
The Perfect Duo: Pair It with Avascan
While Snowtrace gives you the deepest EVM-level detail, Avascan is the cleaner, more narrative companion, especially when you want context or the transaction “story” feels messy.
Real-world example:
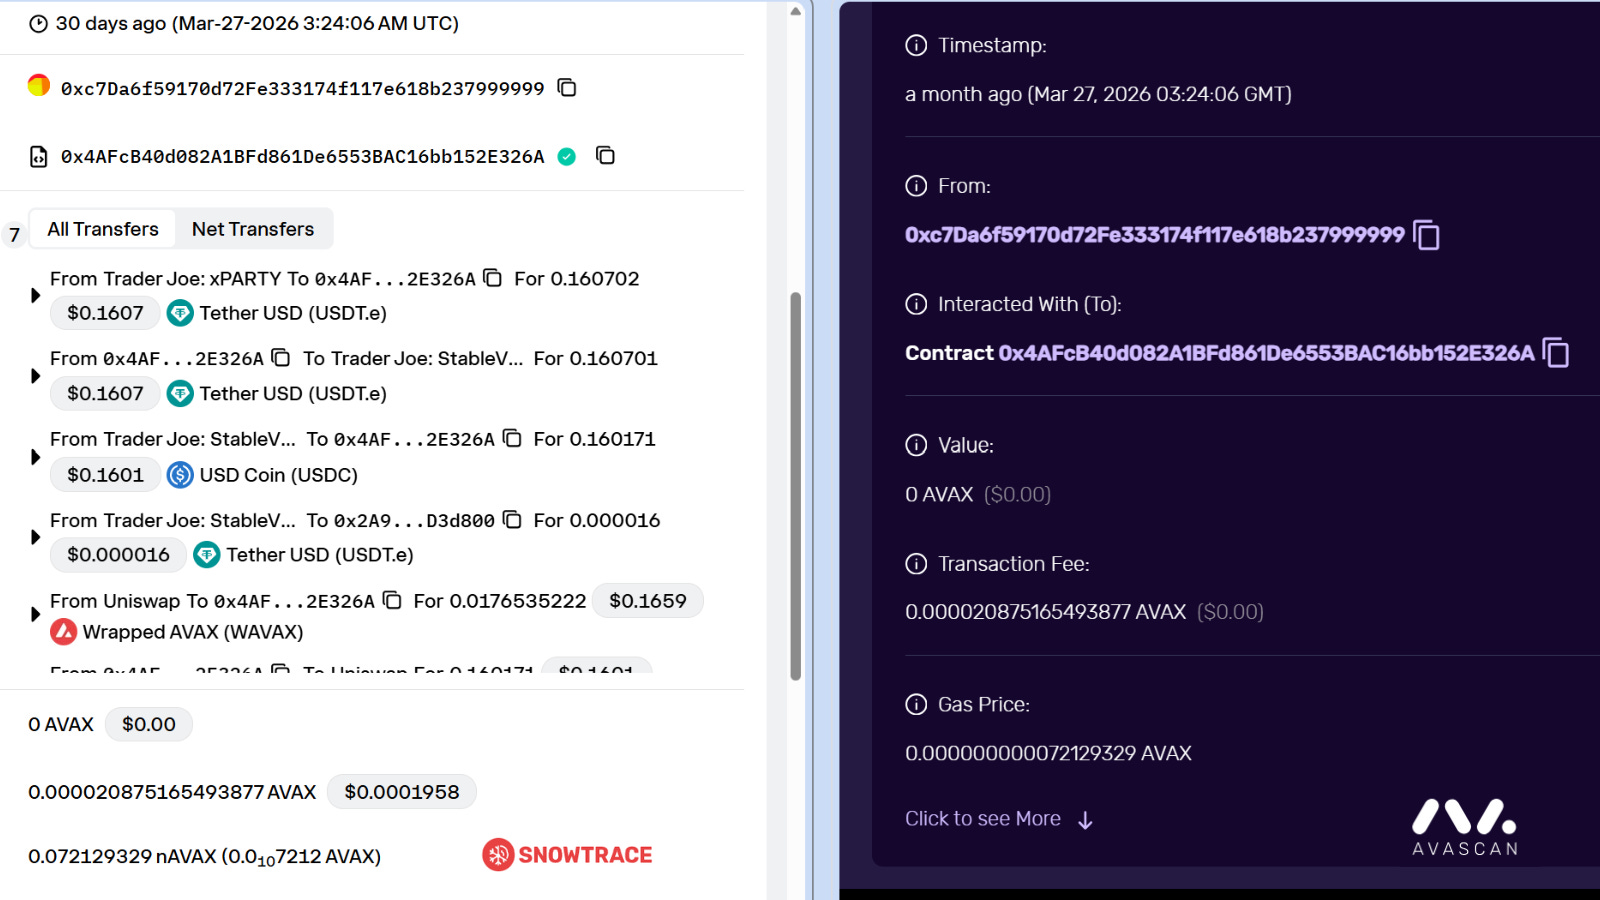
Take this recent Trader Joe (LFJ) swap:
0x4e2ed13da043c7657ca5ff97b5556bac44b2780a9bc579b8355ed86c24494031
On Snowtrace you’ll instantly see the Token Transfers tab with the exact in/out amounts and the detailed Internal Transactions.
Jump to Avascan for the smoother, easier-to-read view of the entire swap path.
Takeaway
Bookmark Snowtrace/SnowScan as your default for any C-Chain transaction or token analysis. Keep Avascan one tab away as the perfect complementary tool.
Scenario 2: “I want validator / network data”
Primary Tools:
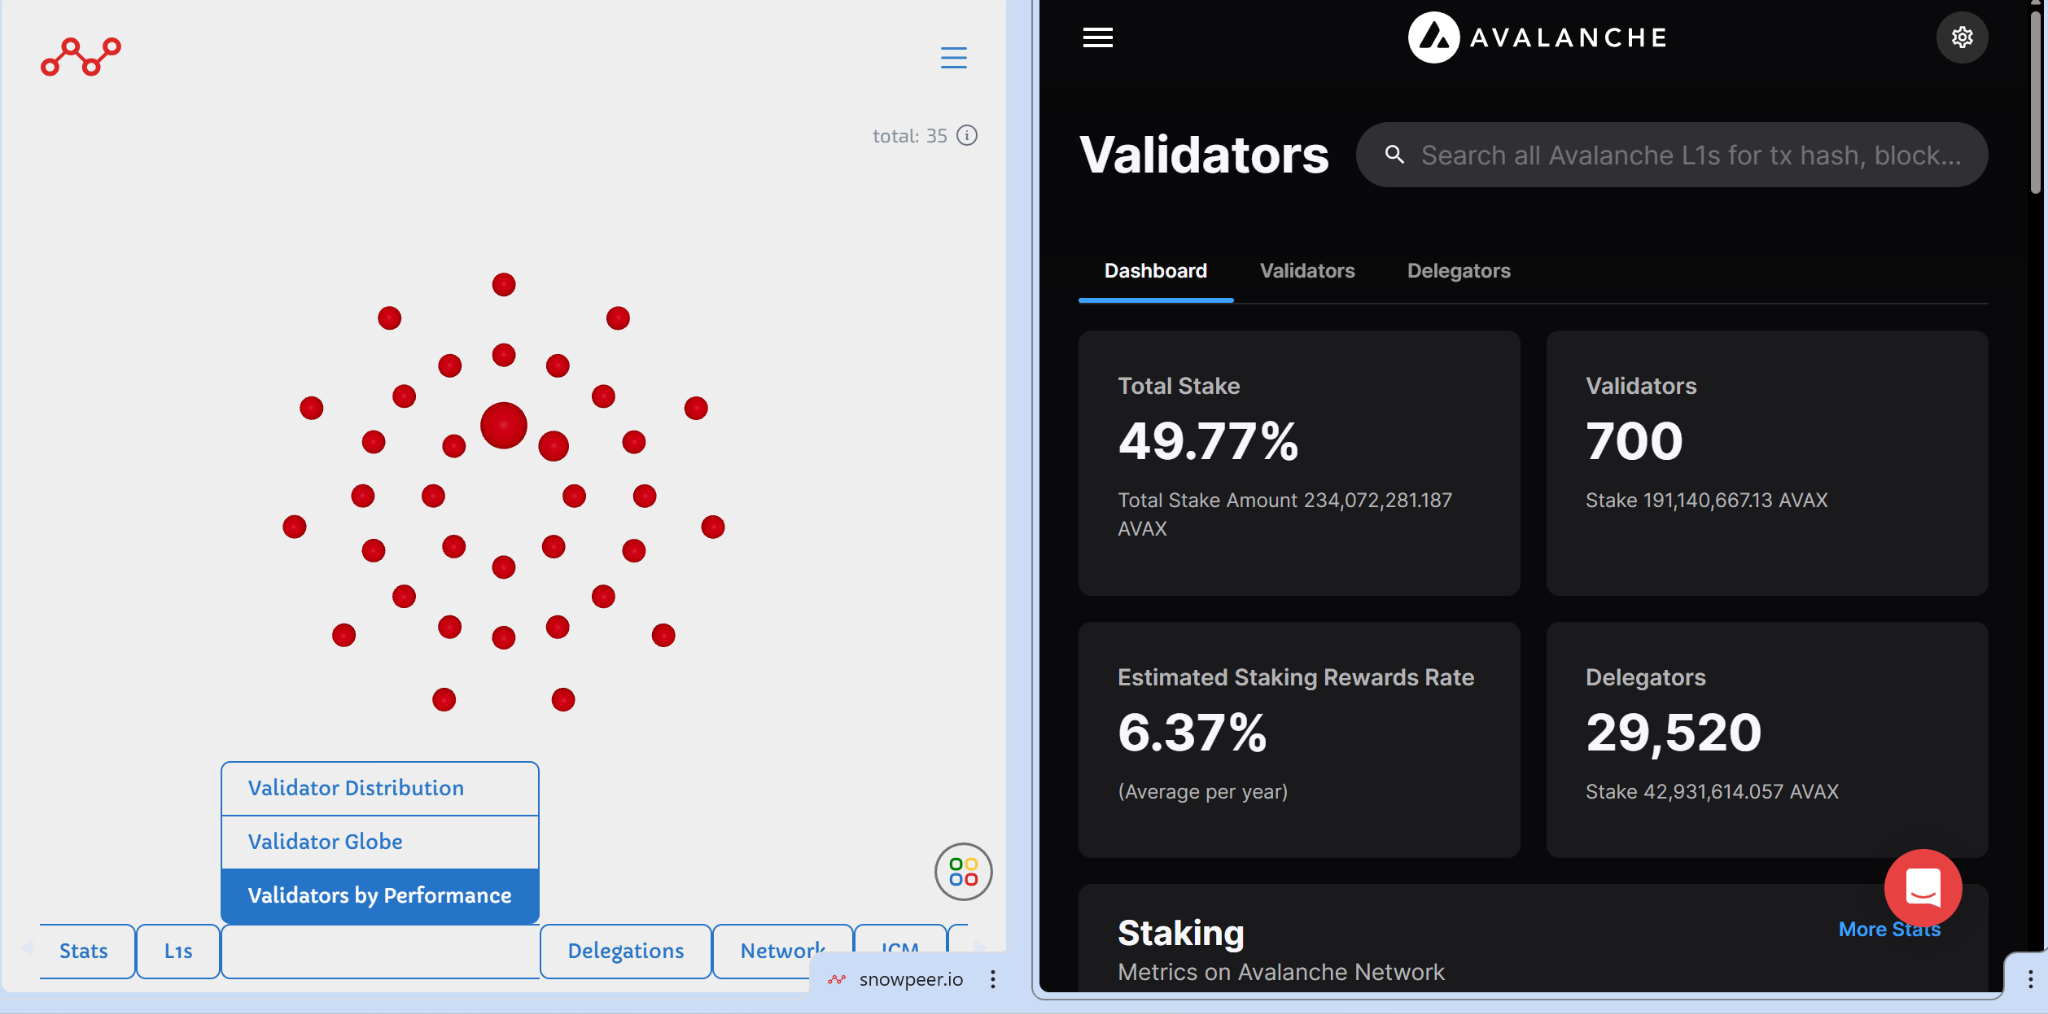
Avalanche’s official Explorer and Snowpeer.
If you are researching staking, evaluating a node, or checking network health, the Avalanche Explorer is the natural starting point. It covers all three chains of Avalanche’s Primary Network, including the X, P, and C chains, and provides direct access to validator sets, staking data, and overall network activity.
If your goal is to understand how many validators are active, how much AVAX is staked, or how the network is evolving over time, this is where you begin. It gives you the ground truth.
The challenge isn’t finding the data, it’s making it useful. While the Explorer provides detailed information on individual validators, including stake, uptime, and delegation history, it is not designed for comparison at scale. Evaluating multiple validators or identifying performance patterns across the network becomes slow and manual.
This is where Snowpeer becomes useful.
Snowpeer is built specifically for validator analytics. It tracks uptime, reward performance, block production, and delegation trends over time. Instead of a static snapshot, it provides a dynamic view of how validators perform across different periods.
In practice, the difference is straightforward.
The Avalanche Explorer lets you inspect a validator.
Snowpeer lets you compare many of them at once.
By applying filters, tracking changes over time, and surfacing performance trends, Snowpeer turns raw validator data into something you can actually act on. It becomes possible to identify which validators are consistently reliable without evaluating them one by one.
Takeaway
Use the Avalanche Explorer for network level facts. Move to Snowpeer when you need to evaluate reliability over time, especially before delegating.
Scenario 3: “I want to track DeFi activity” (DEX Volume, TVL, Lending, Swaps)
Primary Tool:
Explorers are built for individual transactions. They are not designed to summarize thousands of swaps, lending actions, or liquidity movements across protocols.
If your question is about volume, total value locked, or activity across the ecosystem, you need to move up a layer.
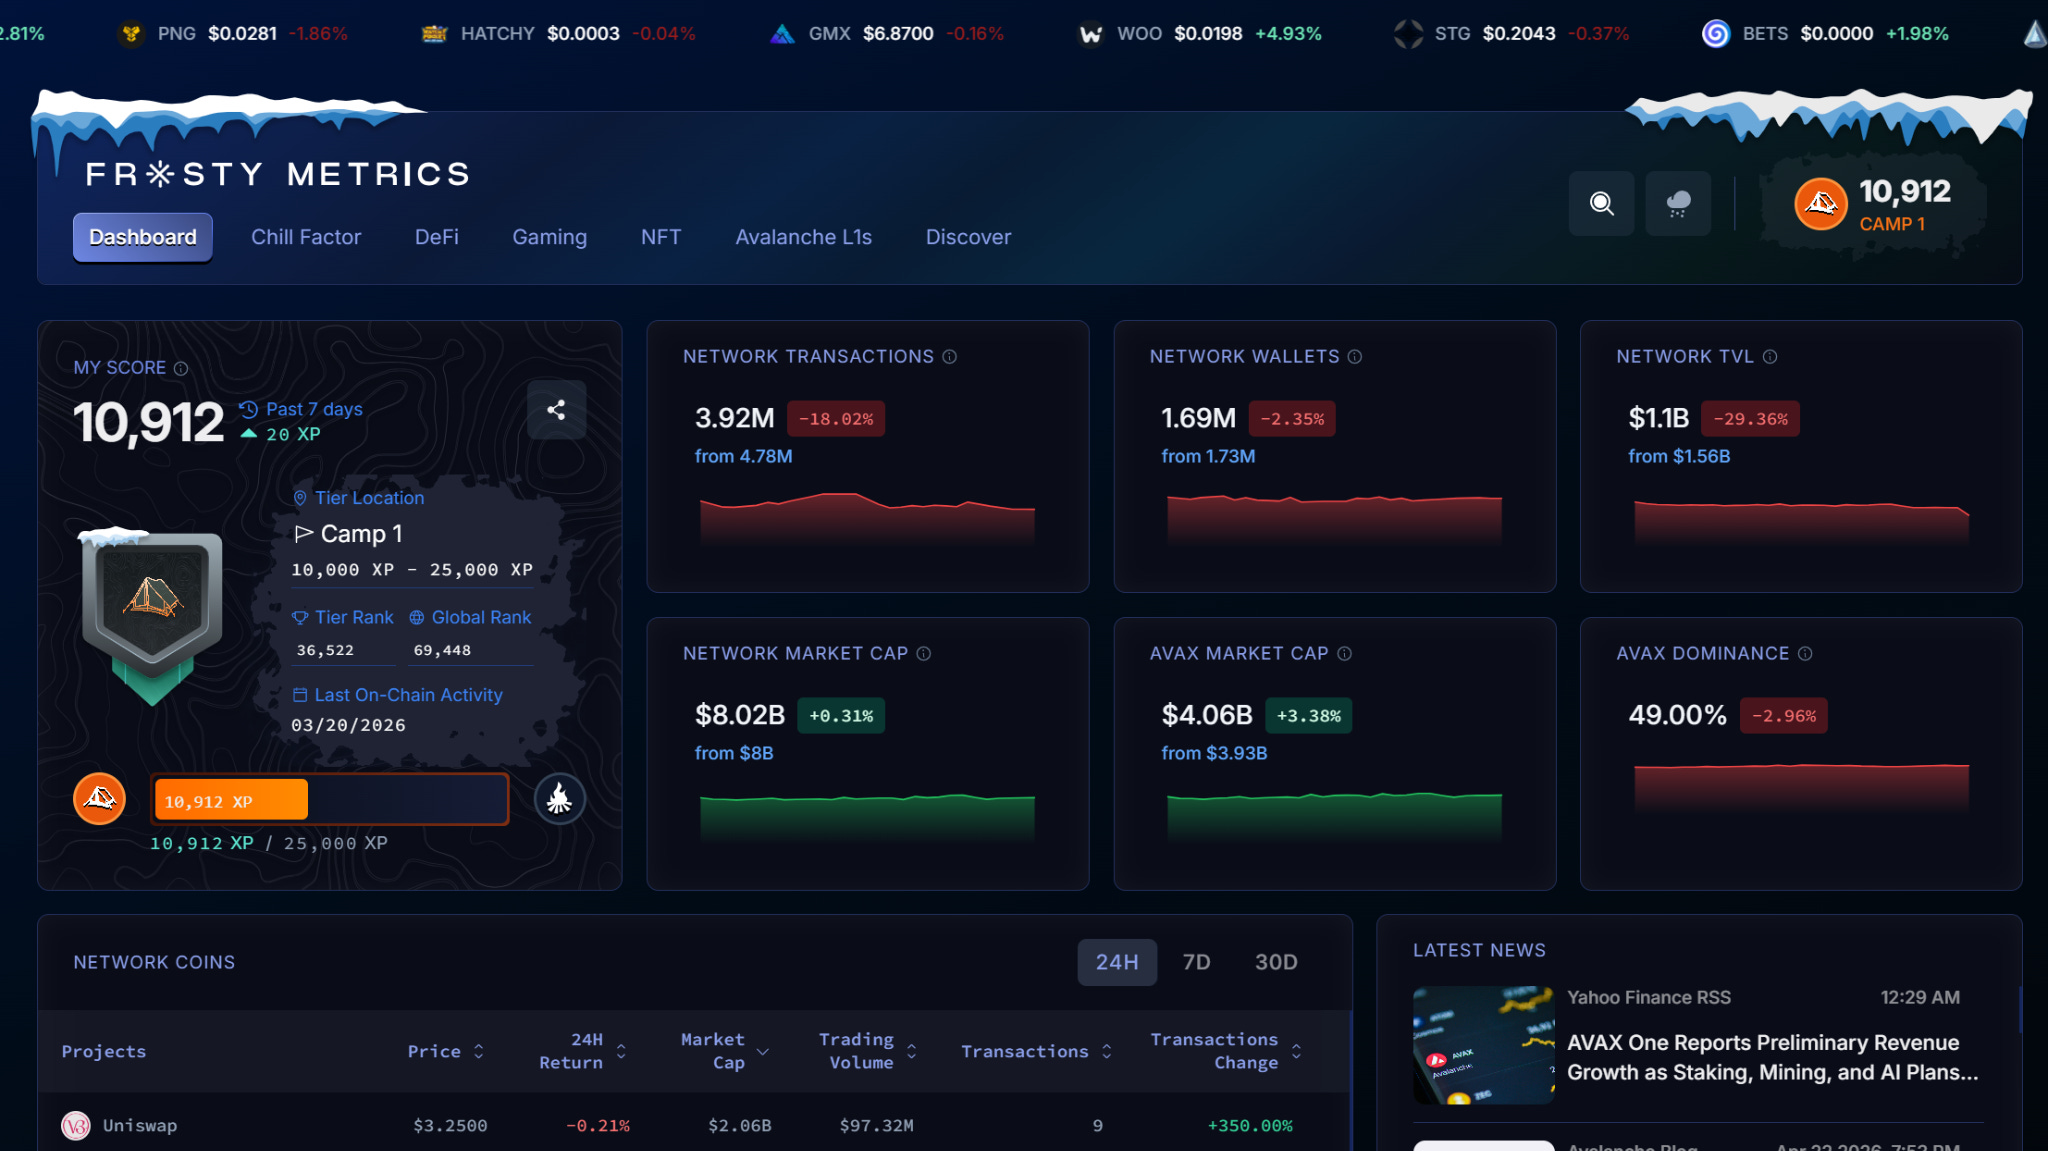
Frosty Metrics is one of the strongest Avalanche-native analytics platforms available. It delivers real-time DeFi dashboards covering DEXes, lending protocols, NFTs, Gaming and Layer1’s, with developer-friendly APIs that already power official Avalanche initiatives including the Chill Factor airdrop.
The data is aggregated, clean, and Avalanche-specific; you are not filtering out irrelevant chains.
For supplementary context:
Snowpeer → Real-time network + DeFi analytics (DEX volume, stablecoin flows, active addresses)
Avalanche Stables → Specialized stablecoin tracking (market cap, dominance, supply) crucial for most DeFi activity
Avalanche Stats / Builders Hub and L1Beat → Broader context on overall network health and L1-level DeFi performance
Helpful non-native complements (when you need maximum flexibility):
Dune Analytics → for fully custom queries and charts (many Avalanche DeFi projects already have community dashboards for Trader Joe, Pangolin, etc.)
DefiLlama → quick cross-protocol TVL and volume overviews
Real-world example:
You’re deciding where to provide liquidity before a protocol becomes much more active and attracts more users and capital.
On Frosty Metrics or Snowpeer you instantly see: “Trader Joe: $10M TVL, 50k txs/day; Pangolin: $2M TVL, 5k txs/day.”
Avalanche Stables shows which stablecoins are dominating those flows.
If you want to go deeper, a Dune dashboard lets you overlay volume trends across every DEX on Avalanche.
Takeaway
Raw explorers (Snowtrace, Avascan, Official Explorer) are great for single transactions but useless for summarizing thousands of swaps or TVL trends. Use Avalanche-native tools like Frosty Metrics and Snowpeer first; they give you the cleanest, most relevant picture without leaving the ecosystem.
Conclusion: The Right Tool Is the Right Question
Onchain data is only as useful as the lens you use to read it.
Avalanche’s exploration stack is deep, but it is not complicated once you map it to intent. Start with raw data when you need facts: a transaction hash, a validator’s listed uptime, a wallet’s transfer history. Move to structured analytics when you need patterns: DeFi volume trends, validator reliability over time, stablecoin flow across protocols. Bring in contextual intelligence only when behavior and relationships matter more than individual events. Most onchain work never needs to leave the first two layers.
The tooling will keep evolving. New L1s, new protocols, and new data surfaces are coming onto Avalanche regularly. But the mental model holds regardless: know what you are trying to answer, identify which layer that question lives in, then pick the tool built for that layer.
That is the difference between reading a transaction and actually understanding what happened.
Dive into the Avalanche ecosystem today! Download the Core Wallet and unlock a world of seamless DeFi, NFTs, and more.
 | A guest post by
|
So much useful information in one post, I absolutely love it
detective Jen on the case